**This post contains affiliate links and I will be compensated if you make a purchase after clicking through my links. As an Amazon Associate I earn from qualifying purchases.
Opinions expressed are based on the Author’s own experience.
When out on a shoot you are always looking for the best possible outcome for your photographs and one of the things that you are probably wondering when you’ve taken it is if you got the exposure you were hoping for. Your first reaction is usually to take a look on your LCD screen, but I’m sure you came across some difficulties when shooting out in the sun. It can be extremely hard to see if you got the exposure you wanted because your photos usually look much brighter than they really are. That is why you should use histograms.
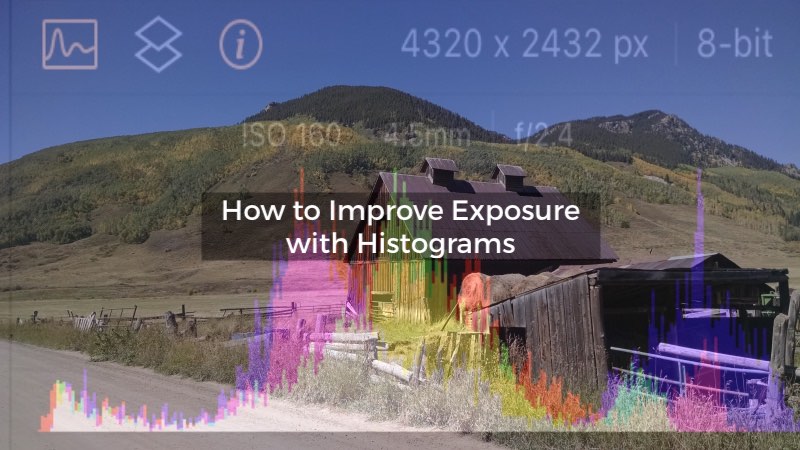
Improving Exposure in your Photographs Using Histograms
Since camera LCD displays never show the real representation of the photos that you took, the use of histograms can help you make sure they turn out just fine.
How is that possible? Well, histograms can give you a mathematical representation of the exposure of your photo. That can be very helpful in getting the best shot possible.
What is histogram?
Before you start using it, you should probably learn a few things about what it is and how it works.
A histogram is a visual representation of the pixel brightness levels that are present in a photograph. Basically, it’s like a graph that lets you see how many bright and dark pixels your photo contains.
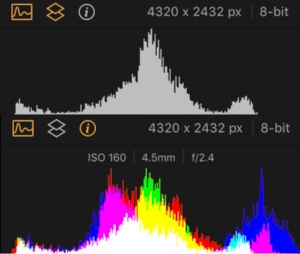
There are two primary types of histograms – the standard luminance histogram and RGB or Three Color Histograms.
The great thing about histogram is that you are able to see in an instant if your photo is exposed properly. When you learn how to use and read histogram you have a possibility to get an instant feedback of the exposure of your photo that is actually more precise than just looking at the screen of the camera.
So, as I said, the histogram gives you a graphical representation of the exposure when you’ve taken the photo. It actually shows you how evenly the photos are exposed in a very precise manner.
Since camera screens effects are mostly based on the conditions of ambient lighting, they aren’t that good at carrying this information forward. The good thing is that there is an option to view the histogram in every camera. Even though there are some compacts that do not depend on the viewfinder to compose a photo, they also show the histogram in real-time.
So that you can fully understand histograms, it is important to understand their purpose. Even though modern cameras mostly have great metric systems, it is still possible to ‘‘confuse’’ the camera’s internal light meter in some lighting conditions that can result in an incorrectly exposed image.
Let’s say your subject has a big bright area that makes a camera meter think it needs to reduce the amount of light that may result in an under-exposed image. Now, if you have a large dark area in the photo that can also confuse the camera to result incorrectly exposed photo but this time it would be over-exposed.
The question that comes up is why can’t you just take a look at the LCD screen and see if the photo is exposed properly. Well, that is possible sometimes but why risking it when you can just use a tool that is precise.
The problem with trusting your LCD display is that it can be deceiving sometimes. If you set it up to maximum brightness your photo might seem like it’s overly exposed even though it really isn’t. Other than that, in some lighting conditions, like in sunlight, the screen can look washed out due to the bright sun. But the most important reason why you should not trust only your LCD is that even in the case of a large LCD on a camera, they are actually too small to correctly estimate the exposure and the color of a photo.
So now that you know all of these factors why risking when you can simply trust your histogram and be certain of the photo’s exposure. It is very helpful especially when you just can’t tell if the photo turned out right and it really saves you the trouble.
Reading a histogram
Now, to fully understand the function that histogram has, just a little reminder about exposure.
A light meter measures the light in a scene and it chooses the exposure that renders a standard 18 percent gray reference card as a mid-tone gray. Since there are many possible exposures that can be used to capture a scene, it represents some kind of a compromise.
The histogram of an image gives you a chance to evaluate what the camera did in no time and lets you decide if you need to make any changes before trying again.
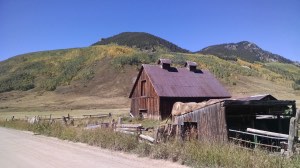
For normal daylight scenes like the one above you expect histogram with an even distribution of tones from black to white.
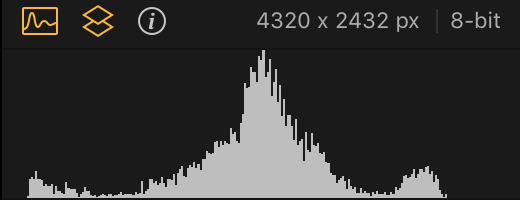
The histogram is very simple to read- it is mapped out by the brightness on a grayscale with white on the right, black on the left and all the shades of gray in between. There are 256 various values of brightness where 0 represents pure black and 255 represents pure white. All of these values are mapped out in a histogram with each pixel of the image assigned to a siren value.
The standard histogram plots darker pixels on the left side and the lighter ones on the right side. So if most of your pixels are on the left side, your photo is probably under-exposed thus it is too dark and lacks detail in the areas of shadow. If most of your pixels are on the right side, then your photo is probably over-exposed and will turn out to be too light with no detail in the bright parts of it.
It is important to know how to read the histogram and to do so you will need to learn what it looks like. Basically, it reminds you of a mountain peak or a range of them. The areas of the photos that have the biggest number of pixels for that color level will have the tallest peak. It’s pretty simple.
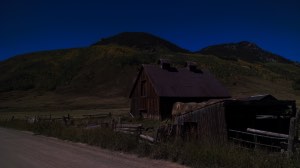
Other than exposure, histograms can also show us the contrast of the image. The one that has low contrast will, probably, have an abrupt peak on the histogram while the one with more contrast will have more like a rounded peak to the histogram. An underexposed scene will have both a sharp peak (due to the black or low-value pixels) as well a concentration of pixels on the left side of the histogram (due to the low exposure)
Underexposed Scene
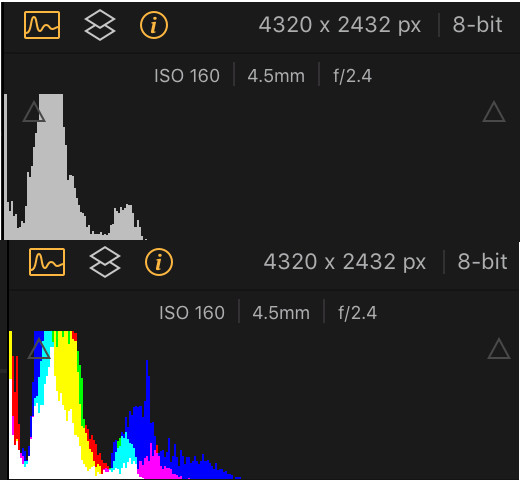
Also, notice in the underexposed histogram the large spike at the leftmost side of the histogram. This represents saturation of black pixels, a typical indication of an underexposure.
Overexposed Scene
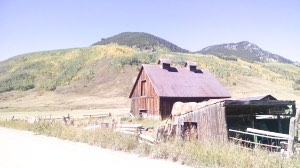
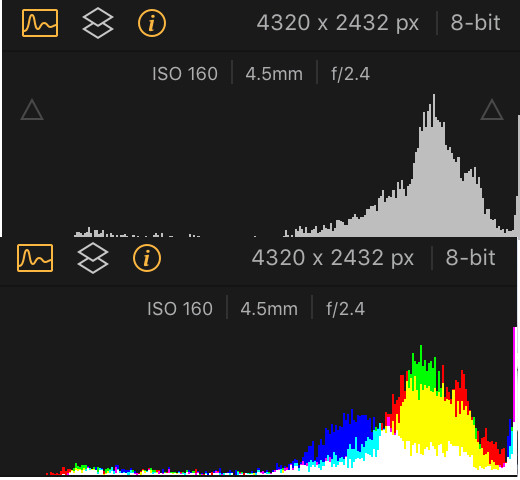
In the overexposed histogram, notice the spike in pixels at the rightmost edge, as well as the lack of pixels at the black side of the scale. This typically indicates that the scene is overexposed with many saturated white pixels.
Even though these are some kind of rules, you should be aware that perfect histogram doesn’t exist. Using histogram doesn’t mean that all of your photos will always be perfectly exposed, it’s not magical that way. The ideal curve for making a photo doesn’t really exist. The one histogram that is right for one scene or one picture isn’t necessarily the right one for the other picture or another scene.
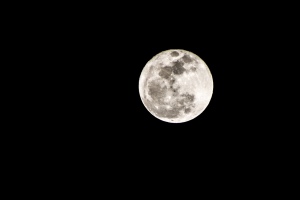
Photo by Francisco De Legarreta C. on Unsplash
Histograms change, they depend on the lighting conditions and the type of photo you are looking to make. Sometimes the best histogram for an image is mostly in the dark or the light side of the histogram and the exposure is still great for the image that you are trying to capture. For example, if you take a photo of the moon at night, almost all of your pixels would be on the left side of the histogram while your image would still be properly exposed.
Photos you take in the nighttime show the histogram bundled to the left side of the graph and the high key photos show tones gathered on the right side
In the histogram of the Full Moon Scene, notice the large concentration of pixels at the left side of the histogram, representing, in this case, the black sky.
It’s important to remember that a histogram is just a tool that gives you some information on the range of tones of a certain image. When you get that information is totally up to you what you do with it – if you make exposure adjustments and shoot again or just keep your image the way it already is – you decide.
.
Conclusion
The histogram is a visualization of the amount of light that your image sensor is capturing at every pixel location. Even though there is no perfect histogram and even though histogram alone cannot give you the information if your picture is over-exposed or underexposed, it does tell you how your image is exposed. There definitely are times when a histogram might give you the impression that your image is under or overexposed but it’s really just right, because of the subject matter.
Some images are just darker because a number of details are on the left side of the histogram in the shadow areas. If that is the case then those images are called low key images and the histogram will then show most of the pixels on the left side. There are also high key images where most of the details are on the highlight of the image and the majority of pixels would show up on the right side of the histogram.
But it’s important to remember that the histogram is usually accurate in showing you the proper amount of exposure of your photo as well as the details in the shadows or highlight areas of it.
Hopefully, this was very helpful for you. Just remember the basics of histogram use and have fun.